State of the Family in America
The decrease of strong families in the United States has major implications for the nation, and by extension, the rest of the world. A nation is only as strong as its citizens, and a lack of strong families weakens human, social, and moral capital, which in turn directly affects the finances (and thus indirectly the military and foreign policy strength) of the United States. A great nation depends on great families, but weak families will build a weak nation.
1. Index of Belonging and Rejection Measurements
The Index of Belonging gives the percentage of U.S. 15 to 17 years old who were raised in an intact family with both their birth mother and biological father legally married to one another since before or around the time of the teenager’s birth. The Index of Rejection provides the corresponding percentage of 15 to 17 year olds who live in broken families in which the parents either never married or are no longer married. Fifteen to seventeen-year-old adolescents on the brink of adulthood are particularly vulnerable as they are forming habits and making decisions that will last a lifetime. Whereas family intactness fosters an environment of belonging among youth that increases their likelihood of excelling in education, health, economic security, and religious practice, family brokenness creates a sense of rejection that can thwart proper growth.
Reports on the percent of all children living in a married family can give a biased picture of the state of marriage, making it more positive than is warranted. For instance, the data used to report the Index at the city level gives San Jose the highest Index of Family Belonging (56 percent). Its score is 69 percent when using all households with children headed by married parents. The difference gives an indication, first, of the proportion of children who are living with stepparents, rather than with both biological parents. Second, it gives an indication of the proportion of younger children who are likely to experience the divorce of their parents before they reach age 18, the effects of which are numerous and long-lasting. The children involved in the difference––those yet to experience their parents' divorce––will be counted in the Index of Family Rejection rather than the Index of Family Belonging. Thus, the Index of Family Belonging is a more realistic instrument for the analysis of the family and its relationship to other social outcomes.
2. 2015 Index of Belonging and Rejection
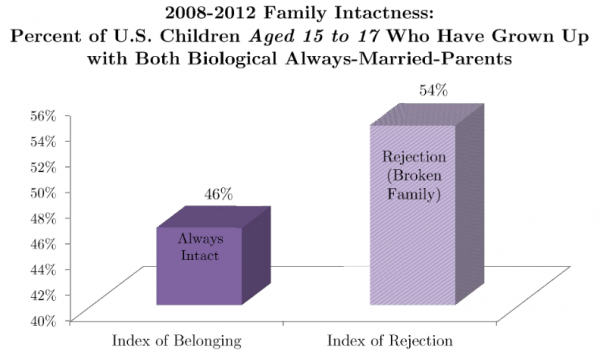
Based on the most recent 2008-2012 data from the U.S. Census Bureau’s American Community Survey,1) the U.S. Belonging Index is 46 percent and the corresponding Rejection Index is 54 percent. This means that 46 percent of teenagers aged 15 to 17 have lived with both biological2) parents always married since their birth, whereas 54 percent of teenagers aged 15 to 17 have lived in broken families with biological parents who either never married or are no longer married.3) The Index of Belonging and Rejection has not changed in any statistically meaningful way since 2008.
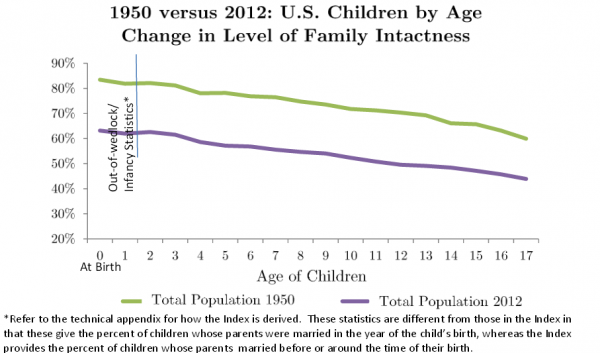
As expected, older children are less likely to live in intact families than younger children due to their parents’ separation.4) Sixty three percent of two year olds live with their always-married mother and father, 57 percent of five year olds, 52 percent of ten year olds, 47 percent of fifteen year olds, and 44 percent of seventeen year olds.
Although the Index of Belonging and Rejection has not significantly changed since 2008, that is not the case for children in their primary years. A growing number of two-year-olds have never lived with their married, biological parents: between 2008 and 2012, the percentage of two-year-olds who lived with both married parents since the time of their birth decreased from 66 percent to 63 percent. Because family intactness during children’s early years has declined, more children face rejection for longer periods of their lives.
By approximately age 8, the difference in family intactness across the years (2008- 2012) was less conspicuous. Therefore, in 2012 more children were born into broken families, but fewer children experienced their parents’ break-up.5)
3. Index of Belonging Over Time
Between 1950 and 2012, the Index of Belonging for U.S. teens aged 15 to 17 dropped by 17 percent. In 1950, 63 percent of American teenagers grew up in an always-married household with their biological mother and father present; however, by 2012 less than half of the total population (46 percent) lived with their biological parents. Correspondingly, the percentage of U.S. children who faced rejection in a broken family increased from 37 percent in 1950 to 54 percent in 2012.
Although American society has made many strides since 1950, its family life has decayed. Many of the social ills that America now faces could have been avoided if family intactness increased rather than decreased.
In both 1950 and 2012, the percentage of children that grew up with a married mother and father decreased as the child’s age increased. Fewer children experienced belonging in 2012 than in 1950 across every age group. This gap is primarily due to an increase in the number of out-of-wedlock births.6) In 1950, 82 percent of two-year-olds lived with their married mother and father; in 2012, 62 percent of two year olds lived with their married parents. The rate of parental break-up between the ages of 2 and 17, however, remained fairly consistent between 1950 and 2012.7)
4. Index of Belonging by State
(See State of the Family Across the States)
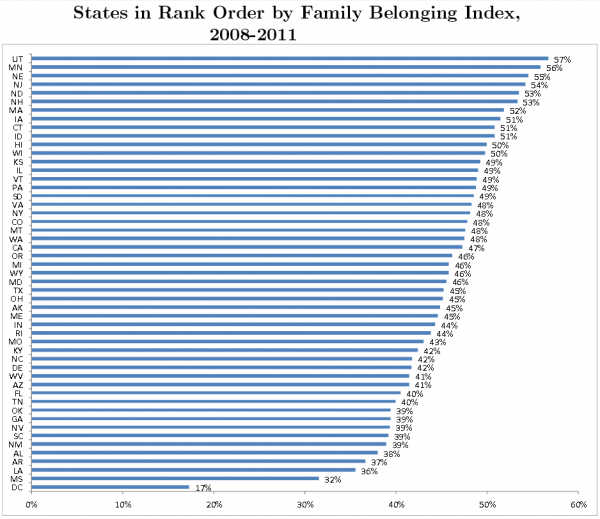
Regionally, the Northeast (50 percent) has the highest Family Belonging Index and the South (42 percent) has the lowest. Utah (57 percent), Minnesota (56 percent), and Nebraska (55 percent) have the highest Family Belonging Indices of all the states, while the District of Columbia (17 percent), Mississippi (32 percent), and Louisiana (36 percent) have the lowest Family Belonging Indices of all the states.
5. Index of Belonging by Race and Ethnicity
(See State of the Black Family)
Family belonging is strongest among Asians (65 percent) and weakest among Blacks (17 percent).
6. The Root of the Problem
If one takes the capacity to raise a family together as the mark of ultimate sexual maturity, then the majority of American adults are sexually dysfunctional. They do not understand how to think about their sexuality holistically, understanding it as a part of who they are, not merely something they do. This lack of a complete view of sexuality means that Americans cannot accomplish the primary purpose of the sexual act: the begetting and raising of the next generation.
Two opposing dynamics—belonging and rejection—are at play among American men and women. When rejection triumphs and a husband and wife reject one another, they are prohibited from living in harmony in a setting of belonging, and this is necessary to raise the children they bring into the world. This rejection is now the dominant feature of American family life and the children of these families, and society as a whole, must bear the burden. The rejection of husband and wife by one another is a private act with very public consequences.
Two great injustices occur when parents reject one another. First, children are not given their birthright: the marriage of their parents, which is a necessity if children are to reach their full potential. Not living in an intact family means that children are likely to live their whole lives with the emotional, relational, and psychological effects of this rejection. The second injustice falls on the rest of the community and the nation, for they have to undertake the added burden of raising the children who are weakened by their parents’ breakup.
7. The Solution
Many reforms are needed in the nation: primarily religious,8) but also financial, educational, legislative, legal, and judicial. However, all else is secondary to a reform in the relationship between mothers and fathers. American men and women need to learn anew how to belong, so that they can not only beget but also raise the next generation together. Correcting this sexual dysfunction is likely our biggest societal challenge. Should that be attained, many of the other reforms will gradually to fall into place: Social security will be reformed because the family unit will be stronger. Education scores will rise very significantly, with significant fiscal benefits. The rates of crime, rape, assault, murder and addictions will drop creating a more just and orderly society. The list continues across all public policy dimensions.
Rejection on the current is a problem new to America and to the world, and new strategies and new forms of leadership are needed to respond to this challenge. Without this change —the restoration of the husband-wife relationship—all other attempts at reform are essentially built on social sand and will collapse over time, for want of a foundation.
This entry draws heavily from original research found in Index of Family Belonging and Rejection: State by State (2011), Family Intactness: Influence on Major State Social Policy Outcomes, and Family Intactness and Public Policy Outcomes by State


